Views, Charts and Dashboards in Dynamics 365 CE
Jessica FaircloughThis article shows how easy is it to use entities and Dynamics 365 analysis tools for any data. Even Jess's running log.

This is a guest post by Jessica Fairclough for session 8, where we talked about views, charts and Dashboards, where we can find these and the benefits of using these tools within Dynamics 365 for Customer Engagement.
Views
These are an important feature within dynamics 365 as they allow the user to create and show specific combinations of data and display them as system or personal ‘views’.
So, lets narrow down the differences between system and personal views… System Views are views that can be viewed by everyone who has access to the instance. So basically, for these views to become ‘system views’ they are either out of the box by default or have been created in the solution itself by a user.
Personal Views on the other hand are views that are made by and used by only you unless you share them with another user. To create a personal view, you can do this within the advanced find tool.
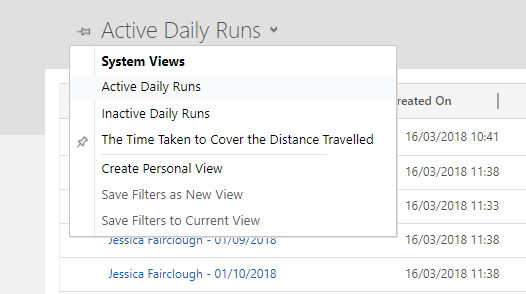
As a feature within Dynamics, as a user you also have the ability to ‘Pin’ your views which means you can basically select a view to default within a specific area. So, while someone who works within sales may want to see different variations of data to someone who let’s say works within the marketing team. This means you can make your workspace personal to you and pin your views appropriately to what you want to see within your workspace.
Charts
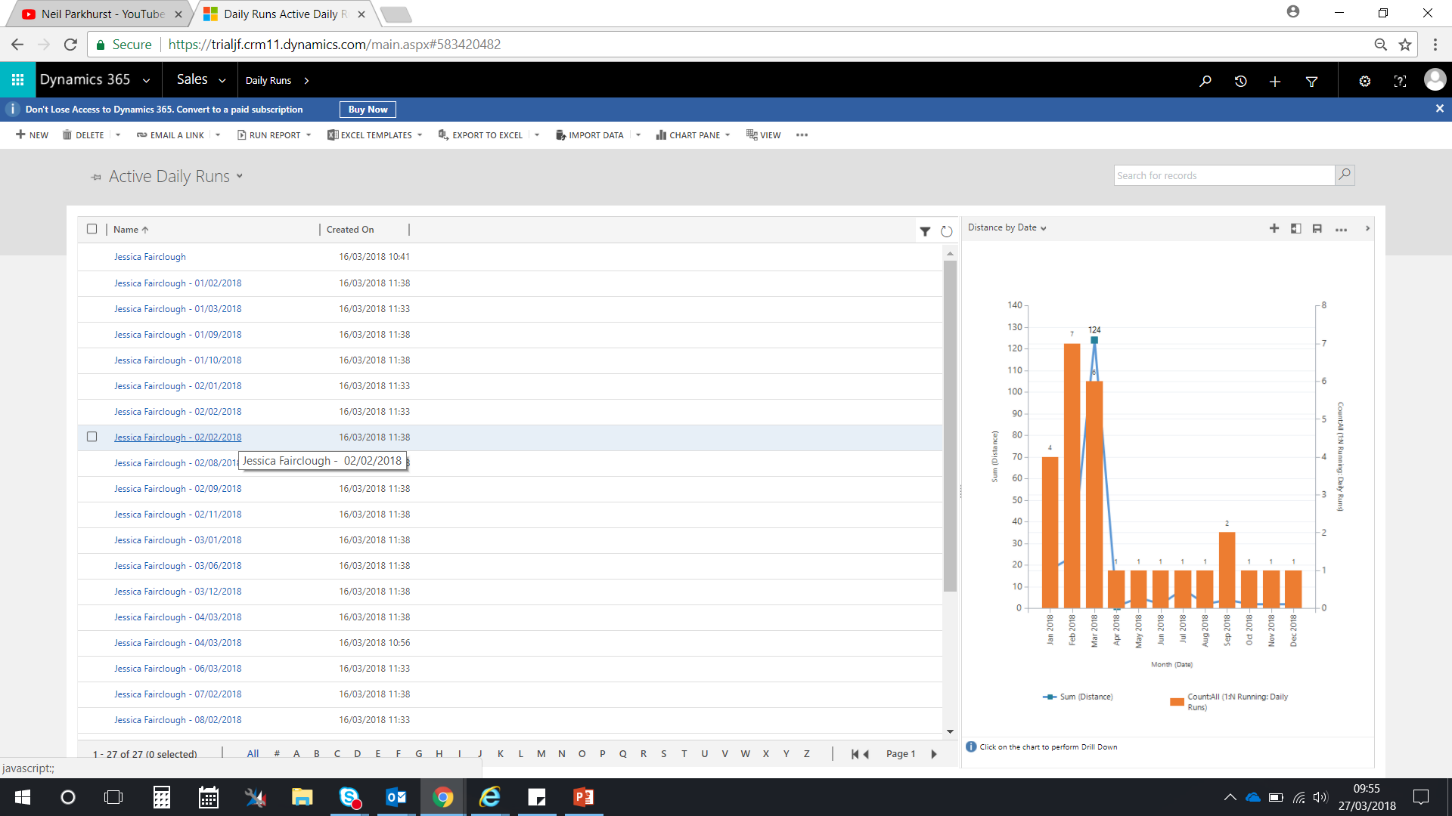
Charts give users the ability to view data for quick, high-level visual analysis. Charts can be created in both the tab or the solution within the system. When creating a chart within Dynamics 365, you will always be asked to select a view for your chart. The view you select is simply dependant upon what you want to show within your chart so it your options may vary between system views and personal views.
There are many benefits of using Charts which include:
-
They allow users to easily drill down to see the underlying records and data that make up a chart. This function allows you to click into a section of the chart and see the data that makes up that specific area.
-
Allow you to customise your dashboards with easy-to-understand visuals of your data. - Charts are one of the main features that’s make up Dashboards within CRM. Again, this allows users to create work specific charts and display these on their Dashboards to view the exact data that they as a user need to view.
-
Allow users to use a variety of different charts (Pie, Column, Bar, Funnel, Line, Multi- series, Stacked & Mixed Chart types)- Depending on what it is that you want the data to show, may depend on the style of chart that you select to use. One of the more useful features of charts is that it allows you to create multi-series, stacked and mixed charts that allow the user to show multiple sets of data in one chart.
-
Allow you to save personal charts that you create and share with others. - So, alike to views, charts can also be made that are personal to only you, however, again there is the ability to share these with other users.
Dashboards
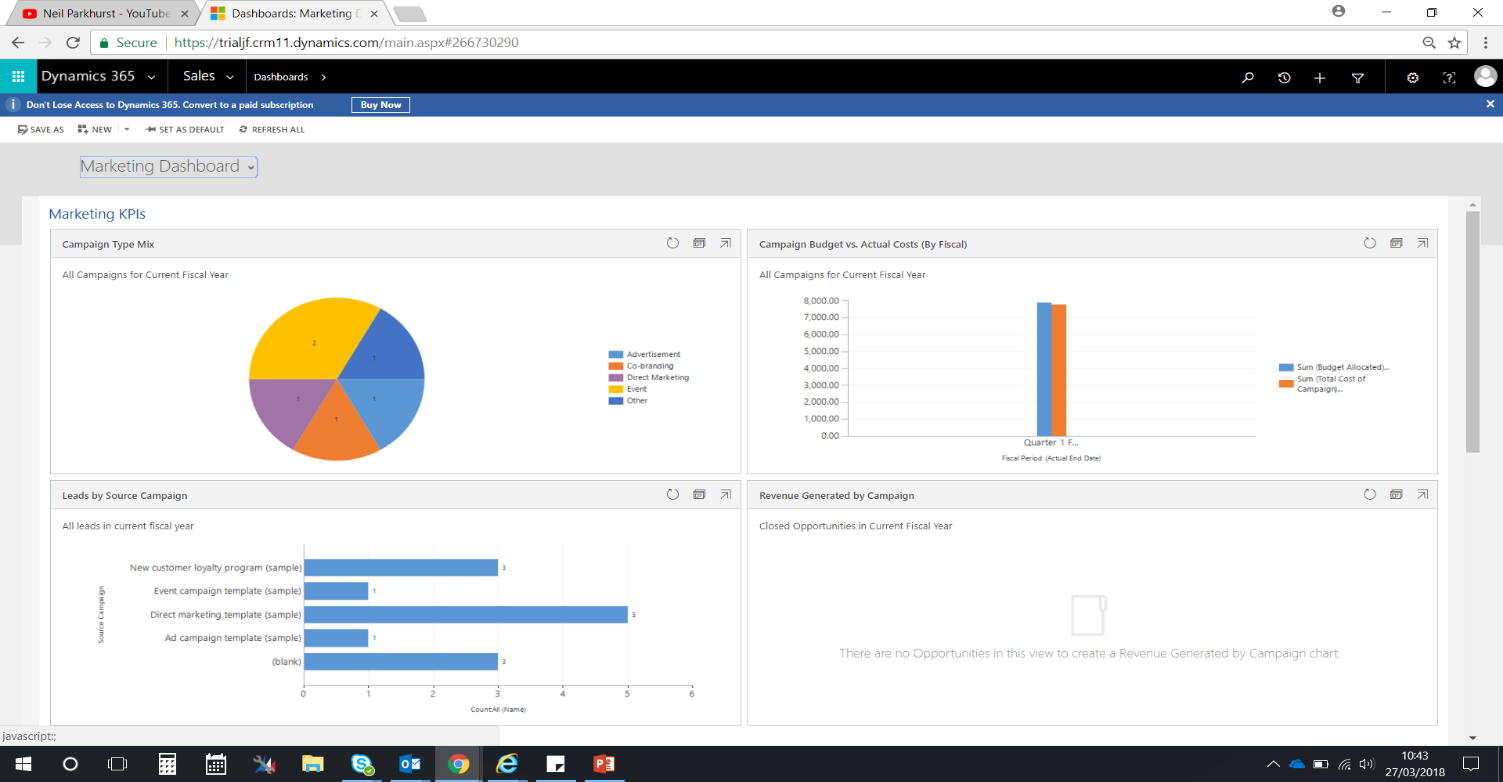
Are a business intelligence tool that allow users to create and view real-time snapshots of data in various forms. Dashboards essentially give users the ability to gather lots of information together to be able to view in one place.
While dashboards are greatly made up from views and charts- they work in a way to provide users with an insight into a specific area where they can pull out the information they need. Again, like views and charts, you can create Dashboards as either system or personal within the system while also giving you the ability to share and pin your desired dashboard.
Dashboards allow you to display a variety of different forms of data, these include:
-
Charts- This function allows the user to select a record type, view and chart to display as a chart within a Dashboard.
-
Lists- Allow you to select a record type and view which will then display the selected options in a list format. (A function to take note of when creating lists is that you won’t be able to see the list until you have saved and published your Dashboard).
-
Relationship Assistant- This tool allows you to provide an insight into the data within your system to help you better understand business relationships. This works through the analysis of data, where a collection of action cards are generated which include a message that summarises what the card is about. In addition to this a set of links for taking action are also created. The assistant sorts the cards by priority and filters them for your current context.
-
Iframes- Allows you to embed content from another location using a HTML Iframe element by selecting a URL in creation. Through using Iframes you can display the contents from another website in a form, for example, in an ASP.NET page.
-
Web Resources- Are “web” files that are stored within CRM that contain content that is useful for integrating web page functionality into the CRM interface. Alike to Iframes, Web Resources allow developers to imbed HTML code within the system. An simple example of a Web Resource would be an image file that has been stored as a web resource.
Useful Links: https://crmbook.powerobjects.com/system-administration/customization/charts-dashboards/ https://crmbook.powerobjects.com/basics/analytics/dashboards/ https://blogs.technet.microsoft.com/lystavlen/2017/04/08/understand-your-business-relationships-with-the-relationship-assistant-in-dynamics-365/ https://msdn.microsoft.com/en-us/library/gg328034.aspx